
We produce an annual Impact Report detailing our activity for the year and measure the impact of our scholarships through The Hope Survey.
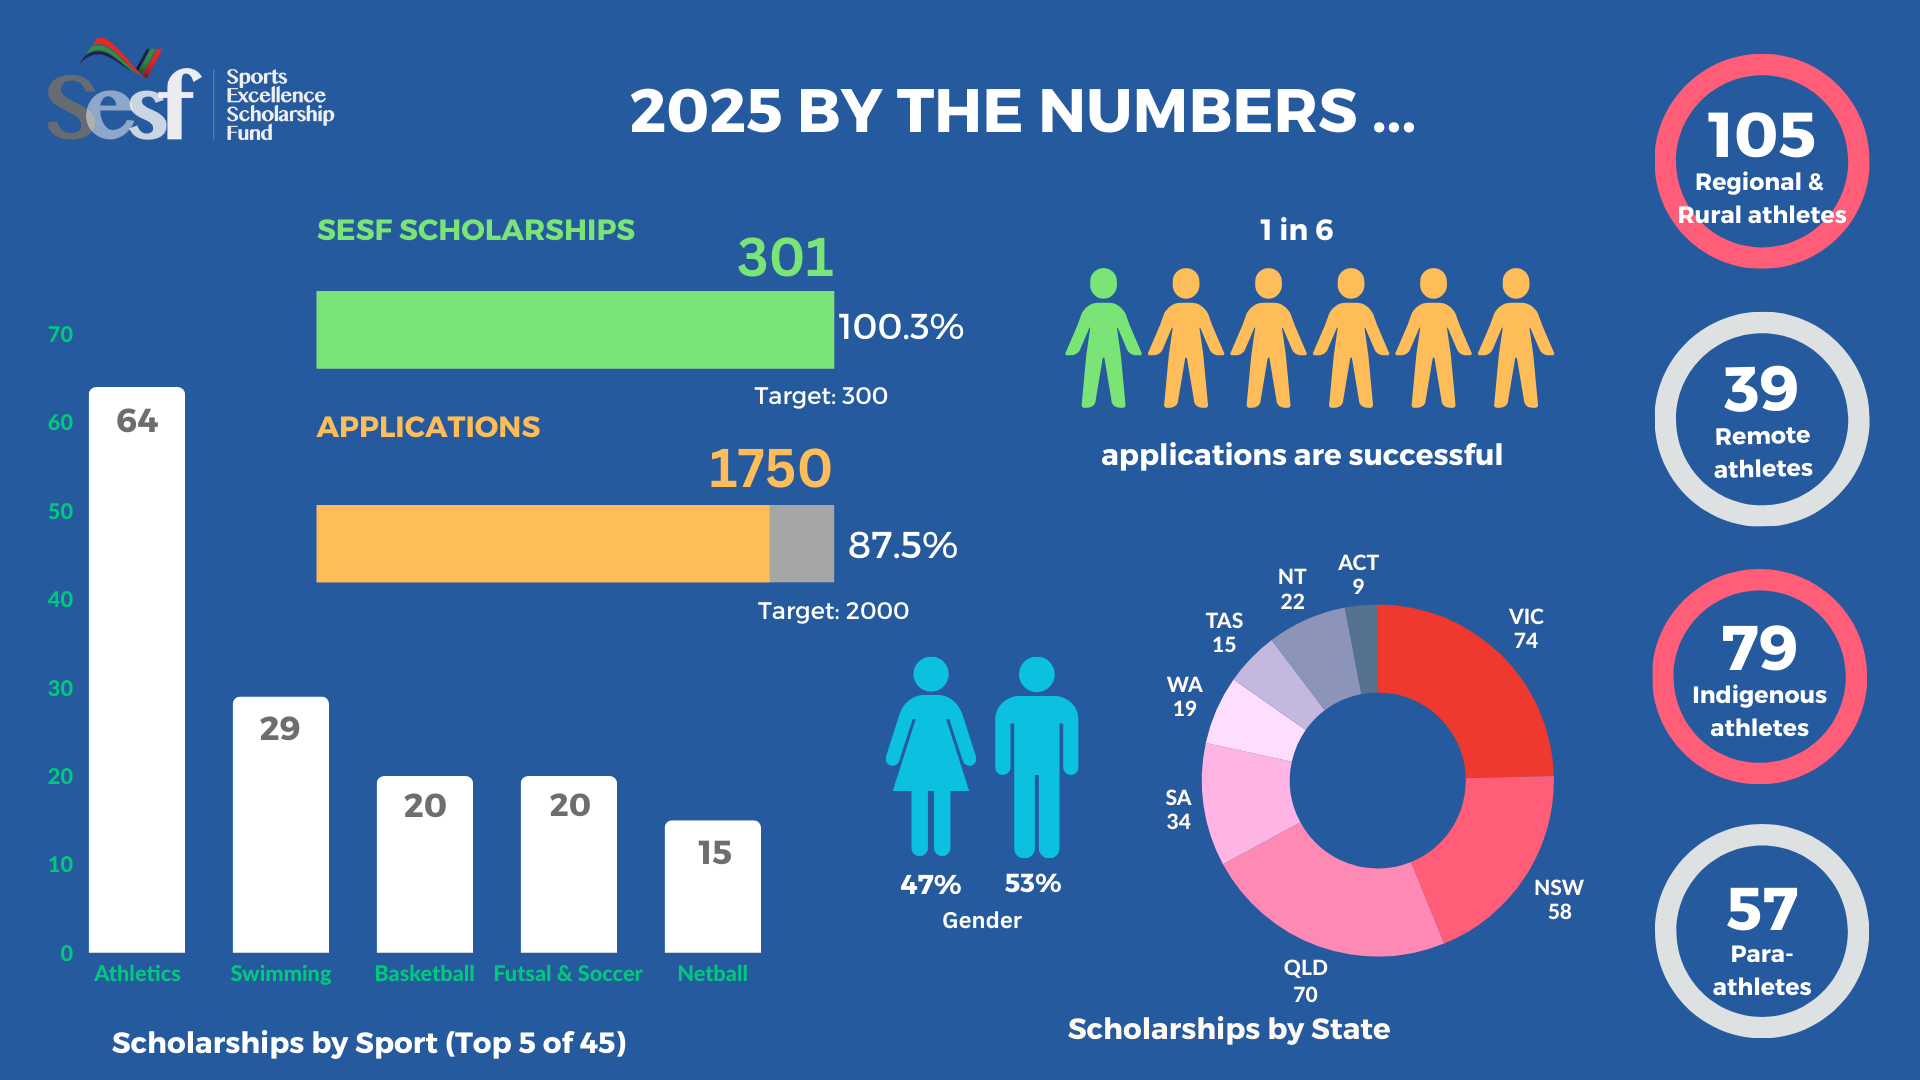
2025 was another record-breaking and milestone year for the SESF as we continue to support talented young athletes across Australia. We are proud to have awarded 301 scholarships to emerging athletes, from our goal of 300, from a total of 1,750 applications. This influx of demand reflects the expanding reach and reputation of SESF and highlights the pressing need for greater access to financial support in sport.
SESF remains dedicated to supporting accessibility and equity in sport for all Australians, including those from underrepresented communities.
In 2025, we awarded scholarships to 79 Indigenous athletes, 57 Para-athletes, 105 regional and rural athletes, and 39 remote athletes. These figures underscore our commitment to building a diverse sporting community and empowering athletes who face additional financial and logistical barriers.
Please click the button below to view the full 2025 Impact Report
We measure the transformative impact of SESF scholarships on youth through The Hope Survey. Our scholarships have fostered life-changing benefits beyond sport.
The survey assesses hope, resilience, and life satisfaction.
The Hope Survey uses the following two standards:
83% of SESF recipients report feeingl hopeful “most”, “lots” or “all” of the time compared to 64% nationally.
29% of females and 32% of males rate their life satisfaction at the highest level vs. 14% and 17% nationally.
71% of females and 91% of males are considered as resilient vs. 55% and 64% nationally.